Struggling to make sense of Forex market trends? Understanding Forex Market Trend Analysis is key to smarter trades. This blog breaks down tools, strategies, and techniques for analyzing trends.
Get ready to trade with confidence!
Key Takeaways
- Forex market trends show price movements: upward (bull run), downward (bear run), or sideways. Traders use these to decide when to buy, sell, or hold.
- Tools like trendlines, channels, and moving averages help traders find trends and predict price changes. Technical indicators such as RSI and MACD are useful for spotting opportunities.
- Volume confirms strong trends in the market moves. High volume supports rising or falling prices, while low volume signals weak moves.
- Key strategies include trendline breakout trading, counter-trend methods using RSI/Fibonacci levels, and Fibonacci retracement for pullbacks or reversals.
- Mastering trend analysis techniques with tools and good timing improves risk management and increases trade success rates in volatile conditions.
Mastering Forex Market Trend Analysis for Successful Trades
Forex trend analysis helps traders understand market direction. It shows if prices will rise, fall, or stay steady.
What is a Forex Market Trend?
A Forex market trend shows how currency prices move over time. It can go up, down, or stay flat. Major trends last months or years and reflect economic trends and data changes like interest rates or inflation.
Intermediate trends run weeks to months and often happen in between larger moves. Minor trends are short, sometimes lasting only hours.
Trends help traders spot where the market is headed next. For example, an upward trend means higher highs and higher lows. A downward trend shows lower highs and lows. In a side-ways trend, prices stay within a set range without clear direction.
These patterns guide decisions on entering or exiting trades for better results.
Types of Trends: Upward, Downward, and Sideways
Trends guide how traders make decisions. In a forex analysis trading system, understanding them is crucial.
- Upward (Bull Run): The price moves higher over time. Higher highs and higher lows form on the chart patterns. This shows strong buying pressure. Traders enter long positions expecting the rise to continue.
- Downward (Bear Run): The price drops steadily over time. Lower highs and lower lows appear on charts. Selling pressure dominates here. Traders sell or short currency pairs for profit.
- Sideways (Rangebound): The price stays between two levels of support and resistance. No clear upward or downward direction exists. Traders focus on scalping profits in this range using boundaries as guides.
Understanding these trends helps identify opportunities, manage risks, and predict price movements successfully.
Why Trend Analysis is Crucial for Successful Trading
Trend analysis helps traders predict future market price movements. By studying past market data, they can spot a current trend upward, downward, or sideways and act accordingly. This knowledge increases the chances of making informed effective trading decisions while reducing risks.
Identifying trends early allows traders to enter or exit at the right time. For example, moving averages and indicators highlight strong trends before reversals occur. Correct timing ensures profits during a trending market sentiment and limits losses in volatile conditions.
Tools for Forex Trend Analysis
Forex trading relies on tools to spot trends and price movements. These help traders make better decisions and plan their next moves in the market.
Trendlines and Channels
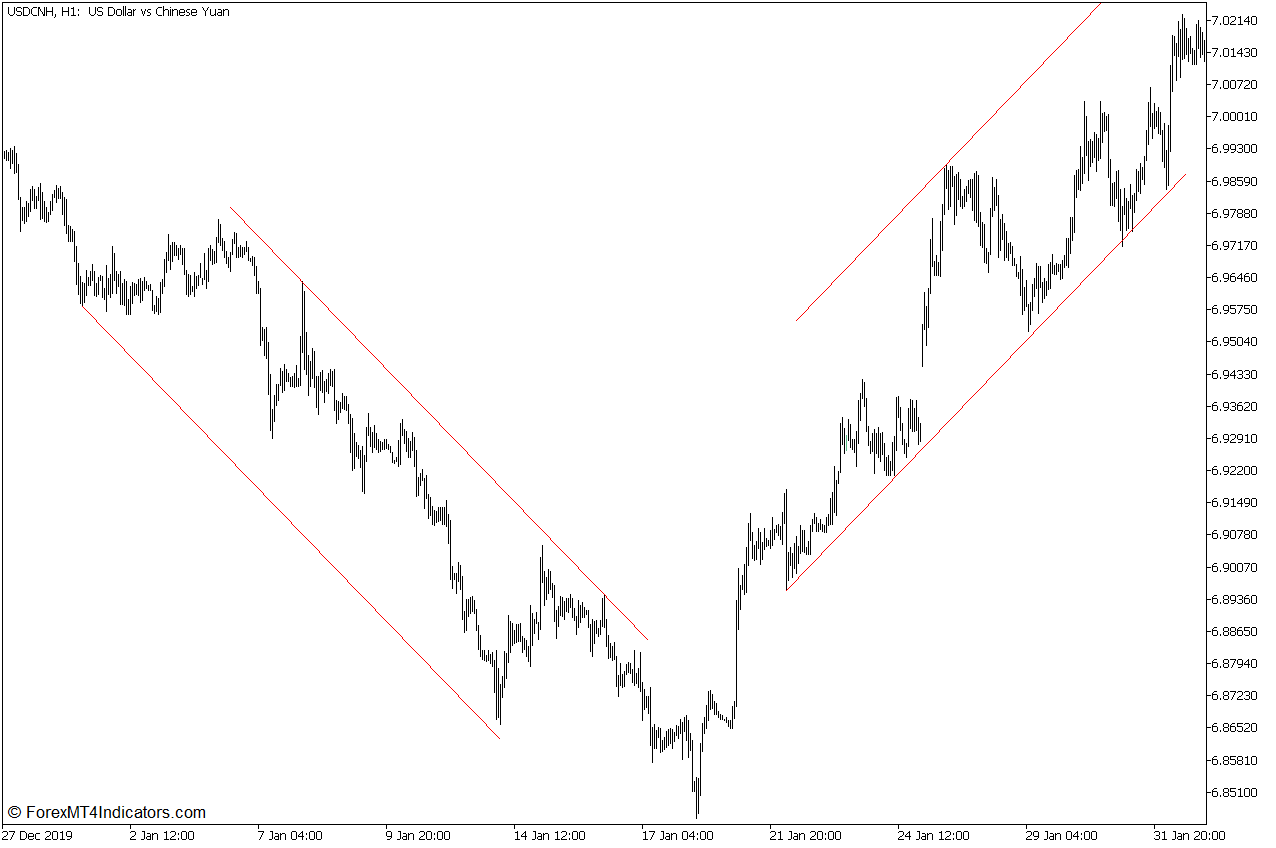
Trendlines connect specific price points on a chart. An uptrend uses three or more rising lows, sloping upward. A downtrend connects at least three highs, sloping downward. These lines help traders identify the direction of the trend for better entry and exit points.
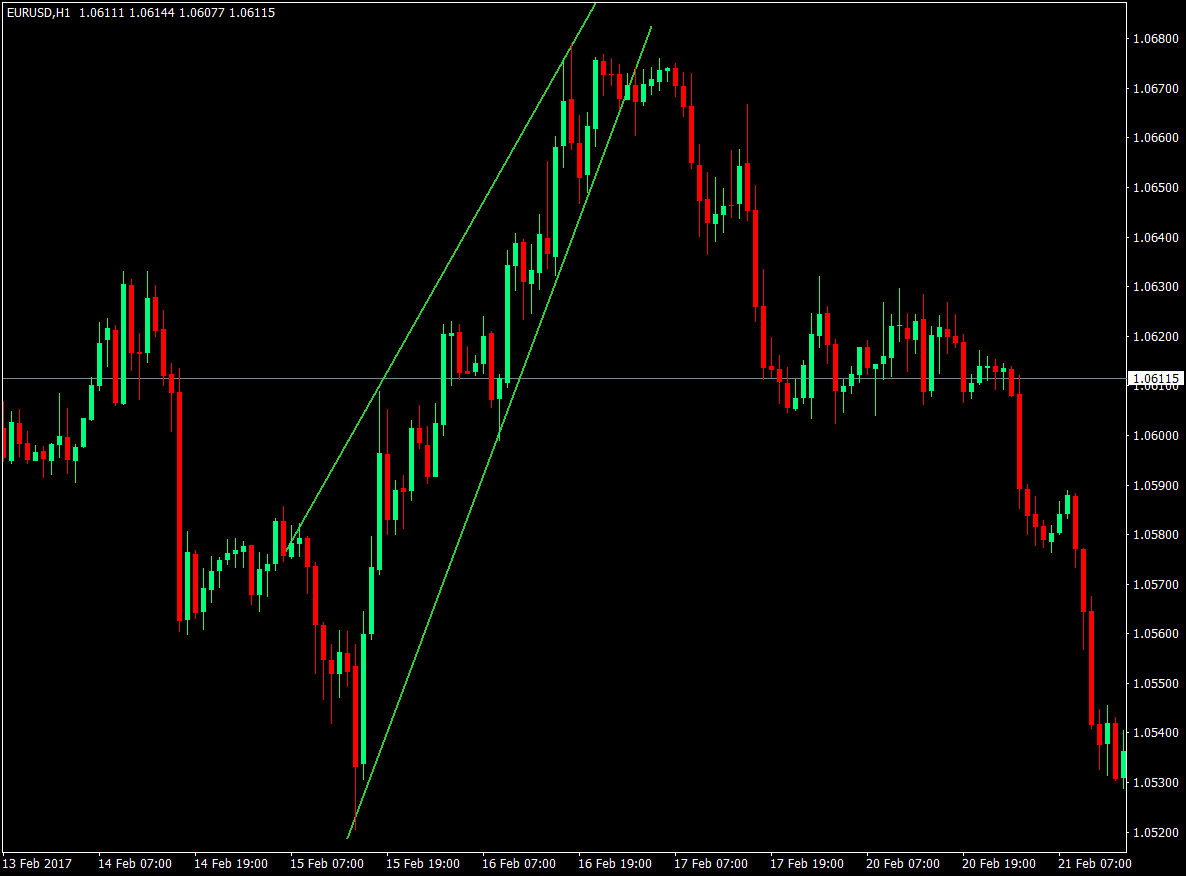
Channels use two parallel trendlines—one above and one below prices. Traders buy near the lower line and sell near the upper line. For example, an ascending channel shows higher highs and higher lows, signaling a bullish market condition.
Patterns like these reveal trends or reversals in forex markets.
Moving Averages and Indicators
Moving averages and indicators are key tools in forex market analysis. They help traders identify trends and predict price movements.
- Moving averages smooth out price data by calculating the average over a set period. For example, the 20-period moving average tracks prices over 20 days.
- Traders use multiple averages, like one based on highs and another on lows, to spot shifts in trend direction.
- The Relative Strength Index (RSI) measures trend strength. A two-period RSI with 90/10 levels shows overbought or oversold conditions.
- Indicators such as MACD combine moving averages to signal potential buy or sell opportunities.
- Fibonacci extensions, like 127.2% and 161.8%, can highlight reversal levels during strong trends.
- Volume analysis shows if market momentum supports the current movement. High volume often confirms strength in trends.
Accurate use of these tools helps traders refine their strategies, leading to the next section on top trading strategies.
Volume and Price Patterns
Volume confirms market strength. High volume during price moves signals strong trends, while low volume shows weakness. For example, a rise in the United States dollar paired with increasing trade volumes suggests solid buying interest.
Price patterns predict future moves. Ascending patterns hint at upward trends; descending ones point to declines. Tools like candlestick charts reveal these shifts. Combining analysis of both can uncover trading platform opportunities and improve timing for entries or exits.
Top Trend Trading Strategies
Using the right trading strategy can help traders make better decisions—read more to learn these key methods and how they work.
Trendline Breakout Strategy
A trendline breakout strategy helps traders spot shifts in market trends. Traders draw a line connecting three or more points on a chart. For an up-trend line, the line slopes upward through lower price points.
In a downtrend, it connects higher price points and slopes downward.
When prices break above or below these lines, it signals a potential entry point. For example, breaking an uptrend line suggests selling might be wise as the trend could reverse. Pairing this with tools like the 50-period three ATR trailing stop refines exits during reversals for precise trades in volatile market movements.
Counter-Trend Trading Strategy
This strategy works by going against the current market direction. Traders watch for trend reversals and enter early to gain profits before others. Technical Analysis Indicators like the RSI (set at 2-period with 90/10 levels) help pinpoint overbought or oversold conditions.
Fibonacci extensions, such as 127.2 and 161.8 levels, predict reversal points where trends might shift. Using a 20-period moving average alongside highs/lows offers more precision in identifying shifts.
Good risk control is key—only trade with proper stop-loss settings to limit losses if the price moves unexpectedly.
Using Fibonacci Retracement Levels
Fibonacci retracement helps traders find key future price action levels during pullbacks. The main retracement points are 38.2%, 50%, and 61.8%. If the price pulls back to these areas, it may continue moving in the original trend direction.
For reversals, Fibonacci extensions like 127.2% or 161.8% can signal potential exit points. For example, if a currency pair moves up and hits resistance at a 161.8% extension, this might suggest a turning point in the market.
leading into other trend strategies!
Conclusion
Mastering Forex trend analysis helps traders make better decisions. It allows them to spot upward, downward, or side-ways movements early. Using tools like moving averages and trendlines improves accuracy.
Clear strategies, risk control, and timing are key to success in the currency market. With practice, anyone can trade smarter and stay ahead of market changes.


